An Investigation of Fatigue and Fracture in LIGA Ni MEMS Structures
S.M.
Allameh*, Y. Yang*, B. Boyce, J. Lou*, W.O.
Soboyejo*
+Princeton Institute of Science and
Technology of Materials
And
Department of Mechanical and Aerospace
Engineering,
*Mechanical Reliability and Modeling
Department,
Sandia National Lab,
Submitted
To
Metallurgical and Materials Transactions
August 2004
An Investigation of Fatigue and Fracture in LIGA Ni MEMS Thin Films
S.M.
Allameh*, Y. Yang*, B. Boyce, J. Lou*, W.O.
Soboyejo*
+Princeton Materials Institute and The
Department of Mechanical and Aerospace Engineering, Princeton University,
Princeton, NJ 08544
*Mechanical Reliability and Modeling Department,
Sandia National Lab,
Abstract
This paper presents the results of and experimental study of resistance-curve behavior and fatigue in a LIGA Ni micro-electro-mechanical systems (MEMS) thin film. Fracture initiation and resistance-curve behavior are studied using compact tension (CT) specimen that are constrained by buckling guides. In-situ observation of cracks in the CT specimen reveal clear evidence of crack-tip plasticity via slip band formation, and the development of bridging ligaments that give rise to resistance-curve behavior, which is characterized on a plot of J integral versus crack extension. The underlying mechanisms of crack growth are then elucidated via fractographic analysis in a scanning electron microscope. Subsequently, the mechanisms of plasticity and crack growth are studied using dog-bone shape specimens that are subjected to cyclic loading at a stress ratio of 0.1. The underlying mechanisms of plasticity are revealed via in-situ and ex-situ imaging with optical and scanning electron microscopes. The implications of the results are discussed for emerging applications of LIGA NI MEMS structures.
I. Introduction
In recent years, LIGA (Lithographic,
Galvanoformung, Abformung) processing, which is the German acronym for
electrodeposition into x-ray etched molds has been used to fabricate Ni
micro-electromechanical systems (MEMS) thin films [1-28] have emerged as candidate
materials for applications in larger and thicker devices (> 20 mm thick) with high aspect ratios [17]. These include:
microswitches, micro-gears and linkage mechanisms, micro-motors and
accelerometers for the deployment of airbags [29]. In most of these potential
applications, there is a potential for fatigue failure to occur at stress
ranges that are significantly below the measured strengths under monotonic
loading [30]. However, the limited prior
work on the fatigue of LIGA Ni MEMS structures made it difficult to diagnose
such failures about 5 years ago [29, 31,
32].
In case of MEMS micro-switches for
weapons deployment, there is a need for very high reliability under single
actuation conditions. Such reliability can only be achieved when the
resistance-curve behavior of LIGA Ni MEMS thin films are known. However, until
this current study, prior efforts to measure the resistance-curve behavior of
LIGA Ni MEMS thin films have been limited by the buckling of fracture mechanics
specimens under load [18]. This buckling was overcome
in the current work by the design and use of buckling guides.
In contrast to the study of
resistance-curve behavior, some efforts have been made to study the fatigue
behavior of LIGA Ni MEMS thin films. The initial work was done by Hemker et al.
[8] and Cho et al. [4, 5], who measured the
stress-life behavior of LIGA Ni MEMS thin films, and compared their results
with previously reported data for annealed and wrought bulk Ni. Most recently,
Allameh et al. [33] have studied the effects of
specimen thickness on the stress-life behavior and the fatigue fracture modes
in LIGA Ni MEMS structures. Boyce et al. [34] have also suggested that
fatigue cracks nucleate from oxide films that form on the surfaces of slip
bands that are induced on the surfaces of cyclically deformed LIGA Ni MEMS
structures. However, a basic understanding of the mechanisms of fatigue crack
nucleation and growth in LIGA Ni MEMS structures is yet to emerge.
This paper presents the results of
an experimental study of the mechanism of fatigue and fracture in LIGA Ni MEMS
thin films. Following a brief description of the material processing and
microstructure micro-texture in Section II, the resistance-curve behavior is
studied by characterizing the crack microstructure interactions that give rise
to J-Da behavior in Section III. This is followed by Section
IV in which the underlying mechanisms of fatigue crack nucleation and
propagation will be elucidated for smooth specimens deformed to failure at a
stress ration of 0.1. The implications of the current work will be discussed in
Section V before summarizing the salient conclusions in Section VI.
II. Material
Two types of samples were used in
this study both of which were made from the same material and by the same
process. The first type of samples consisted of dog-bone shape Ni fabricated by
LIGA (Lithographic, Galvanoformung, Abformung) process. This process consisted
of electroplating Ni in PMMA (polymethylmethacrylate) molds realized by deep
x-ray lithography. Electroplating took place in sulfamate bath with a current
density of 50 mA/cm2. The details of the LIGA process used for these
samples are presented in Ref. [1].
Typical micrographs showing
microstructure of the samples are presented in Figures 1-3. The optical
micrographs were obtained from the top and sidewalls of the samples using 0.05 mm colloidal silica for the final polish. A solution of 10%
nitric acid in ethanol was used to etch the finished surfaces for time periods
of 12-14 min. The focused ion beam images were obtained from the unpolished
sidewalls of the as-received samples.
Predominantly columnar
microstructure of the sidewall cross section of the samples is seen in the
optical micrograph of (Figure
1)(a). Columnar grains are 5 mm wide and 5-25 mm long and
they are oriented parallel to the growth direction. An SEM image of the top
surface of the specimens is included as (Figure
1)(b). A higher magnification
image of the columnar grains is presented in the focused ion beam image of (Figure 1)(c). To show the texture of the
samples, an orientation imaging micrograph (OIM) of the sidewall of the sample
is presented in (Figure
2)(b). The OIM image reveals
predominantly (100) orientation. The growth direction was determined to be
mainly [001]. The bottom of the sample (at the location of the micron marker)
is mostly black. This is due to the size of the fine grains in this area that
is too small for the grains to be indexed. The depth of the bottom unindexable
area ranged from 5-10 microns. Some clusters of such fine grains extended
upward into the sample up to 30 microns.
A second type sample made by the
same LIGA process described above was used for J-a testing. The geometry of
this compact tension (CT) LIGA Ni specimen is shown in (Figure 3).
The samples had dimensions of 12.5 mm x 12 mm x 400 mm with a notch that extended 3 mm into the sample from the
load line.
III. J-Da Behavior
The J integral test sample (Figure 4)(a) was inserted in a jacket (Figure 4)(b) to prevent buckling and mounted on a testing system using special fixtures. The jacket had an observation window that allowed video recording of the moving crack tip using a monoscope equipped with a digital camera mounted on an x-y-z stage. The crack mouth was also photographed using a high resolution SONY[1] digital camera along with National Instrument Labview and Vision Builder software to acquire and record load data and crack mouth opening images during the test. The crack mouth opening displacement was calculated from image analyses using landmark-matching algorithm built in the Vision Builder program. The testing was performed according to the ASTM test procedure E-813 on a single sample as described below.
Test Method for Jic,
A Measure of Fracture Toughness
The compact specimen had a
thickness of 400 mm and a width of 10 mm and a
breadth of 12.5 mm. A stepped notch was created for generating a sharp crack
ahead of the notch tip via cyclic loading or precracking process. Note that the
width of the compact specimen was defined as the distance from the center of
the pinhole to the back surface of the specimen as shown in (Figure 4)(a).
The objective of the Jic
procedure is to determine the value of J near the initiation of crack growth.
The method involves pin loading of fatigue precracked specimens and
determination of J as a function of crack growth. Load versus load-line
displacement is recorded and the J-integral is determined and plotted against
physical crack growth Da, using at least four data
points within specified limits of crack growth. These data reflect the
materials resistance to crack growth. The J versus crack growth behavior is
approximated with a best-fit power law relationship. A blunting line is drawn, approximating
crack tip stretch effects. The blunting line is calculated from material flow
properties. An offset line parallel to the blunting line but offset by 0.2 mm
is drawn and the intersection of this line and the power law fit defines Jic.
B1
(a) Measuring of Load vs. Load Line Displacement
In order to measure the crack mouth opening displacement and
crack extension simultaneously, two cameras are located at the places where
they directly face the crack mouth and crack tip respectively. Each camera is
mounted on a mobile base such that it can track the crack mouth opening
displacement and crack extension in an accurate way. The movement of the camera
is recorded via a micrometer, which is assembled to the base. With the pictures
taken in real time, the displacement of the crack mouth and crack tip extension
can be obtained by image analysis.
Once the crack mouth
opening is obtained, it can be converted to the load line displacement by
assuming a triangular crack profile as shown below. Therefore, the load line
displacement can be expressed as
![]() (1)
(1)
where dLL = load
line displacement; l = distance from the load line to the crack tip; a =
current crack length and dm = crack
mouth displacement. In order to synchronize the load data and image acquisition
process, a program is developed within LabView to establish the one-to-one
correspondence between loading and the related image.
(b) Calculation of JIC
For the compact specimen, the J-integral can be calculated
according to
![]() (2)
(2)
where Jel = elastic
component of J and Jpl = plastic component
of J.
For the elastic component, we have
![]() (3)
(3)
where E = Young’s modulus; n = Poisson’s ratio and K =
stress intensity factor which is expressed as follows
![]() (4)
(4)
where P = external loading; B =
specimen thickness; W = specimen width, a0 = initial crack length
and f(a0/W) is defined as
![]() (5)
(5)
where x = a0/W.
For the plastic component, we have
![]() (6)
(6)
where b0 is the
uncracked ligament; h=
2+0.552b0/W and A = area related to the plastic energy
dissipation during the loading cycles.
From the measure of crack mouth
opening displacement and crack extension, we obtain the relation between the
external load and load line displacement as in (Figure 16).
Therefore, we can obtain the J vs. da curve as follows. According to ASTM
standard, the blunting line is defined as![]() where sy is the yield
strength of the compact specimen. Therefore, the 0.2 mm offset line parallel to
the blunting line is
where sy is the yield
strength of the compact specimen. Therefore, the 0.2 mm offset line parallel to
the blunting line is ![]() With Eq (8) and the
power law fit for the J vs. da curve, which is obtained as
With Eq (8) and the
power law fit for the J vs. da curve, which is obtained as ![]() , we can evaluate the Jic
value by solving the two equations in an iterative manner. Taking sy to be 435
MPa, [12] we obtain
, we can evaluate the Jic
value by solving the two equations in an iterative manner. Taking sy to be 435
MPa, [12] we obtain ![]()
Assuming Jel to Jic in Eq (3) ,we can obtain the
equivalent stress intensity factor ![]()
Note that the values of E and n are taken to be 170 GPa and
0.25 respectively, in the current work. These were obtained from micro-tensile
test results that are summarized in Table 1.
(b) Crack Tip Deformation and
Crack/microstructure Interactions.
The values obtained for Keq and J1c can be compared with values reported for bulk Ni and for nano-crystalline Ni films. In comparison with bulk Ni, as reported by Srinivas et al. [35, 36], our results indicate a higher value. These authors reported a J1c of 0.251-0.210 MPa for Ni samples tested in the temperature range of 77 to 673 °K. In comparison with nanocrystalline Ni (e.g. grain size of about 10-15 nm), our results show higher fracture toughness. Mirshams et al. [37] reported a KR of 72 MPa√m for nanocrystalline Ni with a yield strength of 1307 MPa and a grain size of 19 nm. The KR was found to greatly depend on the annealing temperature. A 200 °C anneal caused a significant drop in the toughness value down to 34 MPa√m. Our fracture toughness is much larger than those reported for bulk Ni alloys. Colmony 5 (with ~80% Ni) hipped samples show a fracture toughness of 15-50 MPa√m depending on their post-HIP anneal. [38].
(c) Fracture Modes
The crack
initiation stage in the CT sample is shown in (Figure 5)(a-e).
Crack tip and crack wake at the later stages of deformation is seen in the
magnified image of (Figure
5)(a). Bridges of 40 and 100 mm widths are shown in (Figure
5)(b) and (Figure 5)(c).
They formed across the crack length during deformation. The fracture surfaces
of the broken bridges are inclined with respect of the loading axis. The
cracking of the sample starts with splitting the main fatigue pre-crack tip and
with the growth of one dominant branch as seen in (Figure
5)(d). This image shows
that the bottom branch is the dominant one, extending and then splitting again
with the bottom secondary branch being the dominant one. Crack branching took
place on planes of maximum resolved shear stress.
Fracture surfaces of the specimen
tested in J-a testing are shown in (Figure
6)(a-e). Different fracture modes
are observed along the crack wake including ductile dimples regions shown in (Figure 6)(a). These regions are surrounded by
smooth fracture areas that are marred by cavities. (Figure 6)(b)
shows the location of these cavities in the general view of the crack. The size
of these cavities is about 15 mm as seen from the magnified
image of the region seen in (Figure
6)(c). Preceding the ductile dimple fracture area,
double shear fracture was observed marked with two ridges and a valley. This
region is was separated from the fatigue Precrack region by a transitional
region that was distinguished by its rough surface, very large
dimples/cavities. (Figure
6)(d) exhibits this region that
demarks the curved fatigue precrack tip. The transition region is also bound by
the two ridges associated with the double shear fracture mode. It narrows to
the end to the valley in between the ridges. The overall view of the area
including the double shear region, the fatigue precrack and the end section of
the notch is shown in (Figure
6)(e). The crack initiation site appears to be close
to the midsection of the notch tip. The tensile mode fracture is associated
with two ridges running along the crack at the two edges of the fracture
surface. The valley between the two ridges indicates necking at the two edges.
The transition area between the tensile and fatigue fracture modes is
associated with the presence of voids.
IV. Microfatigue Testing
(a) Experimental Procedure
The LIGA fatigue
samples used in this study were of dog-bone shape with a total length of 3250 mm The geometry of the fatigue samples is shown in (Figure 3). The two triangular ends were used to
secure the sample in the grips of the microtester. The distance between the two
ends was 1200 microns of which the middle 400 mm corresponded to the gage
section with a uniform width of 200 mm. the areas at
the two sides of the middle section tapered down the gage section.
Dog-bone shape
LIGA Ni samples were tested under cyclic loading conditions using a table top
Instron testing frame equipped with a 50 lb loadcell. To this loadcell, a small
gripping block was attached that housed the triangular end of the dog-bone shape
sample held in a recessed triangular cavity and secured by a washer covering
the sample’s end. A second gripping block of similar geometry was used in the
load train to hold the other end of the specimen. The alignment of the gripping
blocks and the loading of the samples was accomplished by using a traveling
monoscope that is attached to a video acquisition system. The tests were performed in load control mode
and the data were recorded along with the number of cycles to failure.
Some of fatigue
tests were performed using a microfatigue testing system that was developed at Princeton University
The measurement
of the width of the sample and alignments during mounting was performed with an
image acquisition system consisting of a monoscope, the digital camera and
computer related hardware and software (National Instruments, IMAQ Vision®, Vision Builder® and
Labview[3]).
The change in the compliance of the sample was detected and recorded by the
change in the mean position of the actuator reported by the position-monitoring
sensor built in the piezo actuator.
(b) S-N Curves
The results of fatigue experiments
are presented in (Figure
8). The results are consistent
with the previous experimental results obtained for bulk Ni in annealed
conditions. The results are also within
the ball park of the values reported for thinner LIGA samples (26 mm x 250 mm) tested in fatigue [34]. The shape of the S-N curve
appears to be linear rather than curved reported for bulk Ni or for the thinner
LIGA Ni. The scatter in the data does not appear to account for this linear
behavior. The fatigue strength of the sample taken at a fatigue life over 107
cycles was about 200 MPa. This is in agreement with the findings of Boyce et
al. that show test run outs over 107 cycles at a stress level of
~208 MPa. This fatigue strength value is also close to that reported for
annealed bulk Ni. The fatigue strength to ultimate tensile strength ratio is
about 37% as reported here and elsewhere [2, 34] [2]. The results of this study
are also consistent with the results of Cho et al. [3-5] who tested LIGA Ni samples
with comparable thicknesses (e.g. 250 mm). The
latter results are somewhat lower than the values reported by Mohr et al for Ni
[16].
The results of the fatigue tests in
our 270 mm thick samples are somewhat lower
that those we have reported for our thinner 70-mm samples [33]. The major factor that
contributes to this difference is the microstructure of the thinner sample
which is different from that of our samples. While the thinner samples have a
higher volume fraction of fine grains (e.g. , the thicker samples have a higher
volume fraction of columnar grains. The stress-life data obtained for the
thinner sample are consistently higher than those reported for the thicker
samples all the way down to the fatigue limit of ~ 268 MPa.
Crack initiation and crack
propagation in the microfatigue LIGA Ni samples were studied by monitoring the
sample compliance through the mean position of the actuator. Microfatigue tests
were frequently stopped and the samples were transported to the scanning
electron microscope for examination of surfaces. High magnification images
revealed surface features that developed during the test including formation of
slip bands on the sidewalls and initiation of microcracks on the surface.
BSE images obtained from the LIGA
Ni sample right after the formation of microcracks are presented in (Figure 9). Cracks not only formed at the edges
of the sample but also in the middle of surfaces as seen in (Figure 9)(a). Microcracks at an edge (Figure 9)(b) and localized deformation at
another edge (Figure
9) are also observed.
The crack propagation stage was
very short. It consisted of ~ 0.7% of the total life of the LIGA Ni that was
tested at a stress range of 250 MPa. The extension of a crack deep into the
sample is shown in (Figure
10). Crack mouth opening on the
sidewall is presented in (Figure
10)(a) Most of the crack length is
seen to be nearly flat except for the right hand side where crocking takes
place on inclined surfaces where resolved shear stresses are maximum. Magnified
segments of the crack are included to show the various phenomena that take
place during fatigue failure. Crack bridging is illustrated in (Figure 10)(b) with a bridge of ~ 5 mm width separating the two sides of advancing crack. The
termination of advancing crack is clearly accompanied by the imitation of a new
crack and its growth in the vicinity of the terminated crack. A wider bridge
(~10 mm in width) is shown in (Figure 10)(c)
with the fractured bridge ligaments having inclined lip surfaces (Figure 10)(c).
Crack advancement in a zigzag
fashion on intercrossing slip planes is seen from (Figure 10)(d)
where the final fatigue crack may have started. Slip bands are marked on the
image. The length of the inclined segments of the fatigue crack is about 15-20 mm. Crack branching on a large scale with branches traveling
far into the sample is observed in (Figure
10)(e). Multiple branching takes
place, which greatly reduces the energy available for the advancement of the
main fatigue crack. One branch is seen in every bifurcation to be dominant. The
selection is such that the overall planarity of the fatigue crack is preserved.
(Figure 10)(f) shows small scale branching where
the crack tip has just started to branch out on the slip planes. It is
interesting to see the crack growth behavior is not the same on each surface of
the sample. While one side shows nearly no large scale or multiple branching
(only small scale branching observed) (Figure
10)(f), the other side shows the
opposite (Figure
10)(e). This originates from the
difference between the grains sizes associated with the top and bottom of the
sample. A Higher magnification inset of (Figure
10)(g) illustrates crack/grain
interaction with crack advancing in an intergranular fracture mode. The details
of small scale branching is shown in the magnified segment of the crack tip in
(Figure 10)(h).
The presence of cavities observed in the fractured surface
can be attributed to the formation and coalescence of voids ahead of crack tip.
In fact crack blunting takes place once the crack tip reaches such coalesced
voids. The formation of these voids in Ni has been reported to be due to
impingement of slip bands into the grain boundaries [35, 36]. The mutual intersection of the slip
bands has also been shown to cause formation of voids that can coalesce and
form larger cavities [36].
Mechanisms of Fatigue: Early
results of fatigue on resonating rate sensors made of LIGA Ni showed cyclic
fatigue related degradation of the functionality of the balance loop feedback [31]. However, the mechanism
responsible for such change was not explored. The effect of temperature on the
functionality of the LIGA rate sensor was reported to be significant only when
the sensor was resonating [31]. In order to study the
mechanisms of fatigue crack initiation and crack propagation, fatigue tests on
our LIGA Ni samples were stopped at intervals that span the fatigue life of the
specimen. The surfaces of the specimens were examined using SEM for crack
initiation. Although surface flaws are observed to develop during fatigue, the
results of this study do not reveal crack initiation from these surface flaws.
In fact in the presence of surface microcracks, embedded in intersecting slip
bands, and other surface defects (e.g. surface micro steps), the fatigue cracks
initiated from loci far away from these sites.
The results of our studies reveal that slip bands form during cyclic deformation. These slip bands are shown to contain thicker oxide layers (~ 40 nm thick compared to ~ 4 nm thick in the regions that do not contain slip bands) at the specimens’ surfaces [34]. It is conjectured that cracks may nucleate from these oxidized slip bands [34]. However, optical and scanning electron microscopy observations reveal that the dominant cracks (that lead ultimately to failure) nucleate largely from the rough edges (sides) and center of the sidewalls, which were electro-deposited directly into plastic molds. The “crack nucleation” stage is shown to consume between 99 and 99.3 % of the total fatigue life. This subsequent crack growth stage is also shown to occur by mechanisms that depend strongly on the applied stress range.
It has been suggested by Boyce et
al. [34] that stress-induced
intergranular oxidation takes place at the loci of slip bands. Fatigue cracks
were reported by these authors to have nucleated in these locations extending
into the bulk of LIGA Ni specimens. A TEM image of the cross section of the
samples tested in fatigue by Boyce et al. [34] in an
ambient environment (max. fiber stress = +/- 260 MPa, Nf
= 312,000 cycles) is shown in (Figure
11). This image shows persistent
slip bands (PSB) as well as surface oxides next to a microcrack. The length of
this microcrack is seen to be about 700 nm. Other SEM images
of samples tested by these authors [34] have revealed microcracks
as deep as 5 mm.
The mechanism of environmentally assisted cracking of LIGA Ni
as envisioned by Boyce et al. is shown schematically in (Figure 12). The cracking process is a suggested
to consist of a sequence of micro-scale slip of bands in a forward and backward
motion of 1 to n steps (Figure
12). As the persistent slip bands slide
"to-and-fro", they break-up the pre-existing passive oxide, thereby
exposing fresh surface to the environment, and oxidation. Since this occurs
during each fatigue cycle, multiple fatigue cycles can lead to autocatalytic
fretting, and the observed cycle-dependent build-up of the oxide in the region
of PSBs.
Similar to slip bands reported by
Boyce et al. [34], intersecting slip bands
were observed on the sidewalls of specimens tested in this study. Microcracks
were found to form in these areas. However, these microcracks did not grow into
fatigue cracks causing failure of the specimen. In fact, fatigue cracks
observed in this study, did not nucleate from these areas. Instead, the cracks
that finally caused fracture initiated largely at corners of the samples
(Figure…). In selected cases, (Fig. ) surface cracks were also observed to
initiate away from these surfaces and grow to cause final fracture. Details of
the fatigue fracture modes are given below.
(c) Fracture Modes:
Fracture surfaces of the dog-bone sample tested in fatigue at a high stress level are presented in (Figure 13). The only fracture mode apparent from the image is tensile with inclined surfaces that are decorated with deformation bands. The actual fracture surface is very small with cavities present in the very tiny fractured neck area. No trace of fatigue fracture is observed for samples tested at high stress levels.
Samples tested at low stress levels
(e.g. high cycle fatigue) show a predominantly fatigue fracture with a very
small area fractured in tensile mode (Figure
14). The fracture surface consists
of ridges and valleys consistent with a columnar microstructure and an
intergranular cracking. On the surfaces of the ridges, striation-like markings
are observed that run at a 45° angle with respect to the ridge direction. Magnified
inserts of these regions (Figure
14)(b-c) show the tensile and
fatigue regions of the fracture surfaces in more details.
At medium stress levels, fracture
surface of LIGA Ni samples exhibit a combination of tensile and fatigue
fracture in comparable sizes (Figure
15) The BSE images clearly show
the two fractions of fatigue and tensile clearly. The two images of (Figure 15) (b-c) show more details of the
topography of these two regions. (Figure 15) (b) shows slip band formation on an
inclined surfaces of the tensile mode fracture. (Figure 15)
(c) exhibits the fatigue fracture surface reflecting the columnar structure of
the sample. Striation-like fine markings are observed on the surfaces as
labeled on the image.
(d) Implications
The results of the fatigue studies
show the importance of crack nucleation processes in the fatigue behavior of
LIGA processed Ni structures. It is reasonable to assume that the crack growth
regime of fatigue life of small structures is smaller than that of large
structures. However, our results demonstrate that the only major component of
fatigue life is mainly fatigue initiation stage, which spans about 99% of the
life of sample tested at a stress level of 250 MPa.
The other implication of the results of this study is the presence of surface flaws and the contribution of stress-assisted oxidation of persistent slip bands. Careful examination of the samples in SEM showed no correlation between fatigue cracks and surface flaws. This clearly mitigates the importance of condition of the surfaces of Ni small structures in the reliability of MEMS components made by LIGA process. This is particularly important for LIGA processed structures that might have serrated sidewalls (although on micro-scale). These sidewalls cannot be polished easily.
The SEM images obtained from
fatigued specimens suggest crack initiation takes place from subsurface
regions, possibly flaws embedded under surface. This, in turn, suggests that a
practical way to enhance the life of LIGA Ni components is by reducing the
sizes of the flaws that give rise to crack nucleation. These may be achieved
through refinement to the plating chemistries and processing parameters.
Surface treatments may also be used to further enhance the resistance to crack
nucleation, which dominates the fatigue life of LIGA Ni MEMS structures.
Summary and Concluding Remarks
The
fracture/resistance-curve behavior and the fatigue behavior have been studied
in a LIGA Ni MEMS thin structure. Salient conclusions arising from the work are
summarized below:
1) The LIGA Ni MEMS thin films exhibit rising J-a curve at room-temperature. This is associated with crack-tip shielding by ligament bridging, and crack-tip deformation that gives rise to slip band formation. The fracture toughness, J1c, is estimated to be 0.0435 MPa.m. The equivalent stress intensity factor, Keq, is 88.8 MPa√m. This is comparable to 72 MPa√m reported for nano-crystalline Ni [37].
2)
The LIGA Ni MEMS structure exhibits an endurance limit
of ~ 200 MPa. This is comparable to that obtained for the annealed bulk Ni, but
less than that obtained for hardened bulk Ni.
3)
Fatigue failure above the endurance limit occurs due
to a compilation of slip band formation, surface oxidation of slip bands, and
crack nucleation from oxidized slip bands, and the sub-surface nucleation of
regions near the jagged boundaries in the sidewalls. In most cases, however,
final failure occurs from sub-surface cracks nucleated near the sidewalls. The
total fatigue life is also dominated by the crack nucleation stage over the
range of cyclic stresses that was examined in this study.
Acknowledgement
Research supported by National Science
Foundation DMR (Grant Number __NSF Ni and NSF IMI).
Appreciation is extended to the Program Managers, Dr. Joe Akkara, Dr. Bruce
MacDonald and Dr. Carman Huber.
Table 1.
Comparison of LIGA Ni Properties with Bulk Ni
|
Thickness/Strength |
70-mm |
270-mm |
Hemker [9] |
Others [15, 39] |
Bulk Ni [40] |
|
Yield
Strength (MPa) |
630 |
435 |
150 |
441 |
59 |
|
UTS (MPa) |
735 |
575 |
170 |
555-2470 |
|
References
1. T.E. Buchheit, T.R. Christenson, D.T. Schmale, and D.A. LaVan, "Understanding and tailoring the mechanical properties of LIGA fabricated materials," Materials Research Society Symposium - Proceedings, 1999, 546 pp. 121-126.
2. T.E. Buchheit, D.A. La Van, J.R. Michael, T.R. Christenson, and S.D. Leith, "Microstructural and mechanical properties investigation of electrodeposited and annealed LIGA nickel structures," Metal. Mater. Trans., 2002, 33 pp. 539 Submitted.
3. H.S. Cho, W.G. Babcock, H. Last, and K.J. Hemker, "Annealing effects on the microstructure and mechanical properties of LIGA nickel for MEMS," Materials Research Society Symposium - Proceedings, 2001, 657 pp. EE5231-EE5236.
4. H.S. Cho, K.J. Hemker, K. Lian, and J. Goettert, "Tensile, creep and fatigue properties of LIGA nickel structures," Presented in Technical Digest. MEMS 2002 IEEE International Conference. Fifteenth IEEE International Conference on Micro Electro Mechanical Systems, 2002, Piscataway, NJ, USA, IEEE, pp. 439-442.
5. H.S. Cho, K.J. Hemker, K. Lian, J. Goettert, and G. Dirras, "Measured mechanical properties of LIGA Ni structures," Sensors and Actuators, A: Physical, 2003, 103 (1-2) pp. 59-63.
6. T.R. Christenson, T.E. Buchheit, D.T. Schmale, and R.J. Bourcier, "Mechanical and metallographic characterization of LIGA fabricated nickel and 80%Ni-20%Fe Permalloy," Materials Research Society Symposium - Proceedings, 1998, 518 pp. 185-190.
7. J.C. Fox, R.L. Edwards, and W.N. Sharpe, Jr., "Thin-film gage markers for laser-based strain measurement on MEMS materials," Experimental Techniques, 1999, 23 (3) pp. 28-30.
8. K.J. Hemker, H.S. Cho, Y. Desta, K. Lian, L.K. Jian, and J. Goettert, "Tensile, Creep and Fatigue Testing of LIGA-Ni Microsamples," Presented in HARMST 2001, 2001, Baden, Germany.
9. K.J. Hemker and H. Last, "Microsample tensile testing of LIGA nickel for MEMS applications," Materials Science and Engineering A, 2001, 319-321 pp. 882-886 TY - JOUR.
10. H. Jin, E.C. Harvey, J.P. Hayes, M.K. Ghantasala, A. Dowling, M. Solomon, and S.T. Davies, "Laser-LIGA for serpentine Ni microstructures," Proceedings of the SPIE - The International Society for Optical Engineering, 2001, 4592 pp. 166-171.
11. H.R. Last, K.J. Hemker, and R. Witt, "MEMS material microstructure and elastic property modeling," Materials Research Society Symposium - Proceedings, 2000, 605 pp. 191-196.
12. J. Lou, P. Shrotriya, S.M. Allameh, N. Yao, T.E. Buchheit, and W.O. Soboyejo, "Plasticity Length Scale in LIGA Nickel MEMS Structures," Presented in MRS Fall Meeting, Symposium B: Materials Science of Microelectromechanical Systems (MEMS) Devices IV, 2001, Boston, MA, pp. B2.5.
13. H. Majjad, S. Basrour, P. Delobelle, and M. Schmidt, "Dynamic determination of Young's modulus of electroplated nickel used in LIGA technique," Sensors and Actuators A: Physical, 1999, 74 (1-3) pp. 148-151 TY - JOUR.
14. C.K. Malek and L. Thomas, "High-aspect-ratio electroformed Ni-Co microstructures with improved mold adhesion using a LIGA-like process and a Novolak sublayer," Proceedings of the SPIE - The International Society for Optical Engineering, 2000, 4019 pp. 484-491.
15. E. Mazza, S. Abel, and J. Dual, "Experimental determination of mechanical properties of Ni and Ni-Fe microbars," Microsystem Technologies, 1996, 2 (4) pp. 197-202.
16. J. Mohr and M. Strohrmann, "Examination of Long-Term Stability of Metallic LIGA Microstructures by Electromagnetic Activation," J. Micromechanics and Microengineering, 1992, 2 pp. 193-195.
17. F. Munnik, F. Benninger, S. Mikhailov, A. Bertsch, P. Renaud, H. Lorenz, and M. Gmur, "High aspect ratio, 3D structuring of photoresist materials by ion beam LIGA," Microelectronic Engineering, 2003, 67-68 pp. 96-103.
18. C. Oropeza, "A New Approach to Evaluate Fracture Strength of UV-LIGA Fabricated Nickel Specimens," Louisiana State University, 2002.
19. W.N. Sharpe Jr. and A. McAleavey, "Tensile properties of LIGA nickel," Proceedings of SPIE - The International Society for Optical Engineering, 1998, 3512 pp. 130-137.
20. W.N.J. Sharpe, D.A. LaVan, and R.L. Edwards, "Mechanical properties of LIGA-deposited nickel for MEMS transducers," International Conference on Solid-State Sensors and Actuators, Proceedings, 1997, 1 pp. 607-610.
21. P. Shrotriya, S.M. Allameh, J. Lou, T.E. Buchheit, and W.O. Soboyejo, "On The Measurement of the Plasticity Length-Scale Parameter in LIGA Nickel Foils," Mechanics and Materials, 2002, In Press.
22. D. Sparks, D. Slaughter, R. Beni, L. Jordan, M. Chia, D. Rich, J. Johnson, and T. Vas, "Chip-scale packaging of a gyroscope using wafer bonding," Sensors and Materials, 1999, 11 (4) pp. 197-207.
23. D.R. Sparks and S.-C. Chang, "Automotive applications for micromachining," Proceedings of the SPIE - The International Society for Optical Engineering, 1997, 3223 pp. 218-222.
24. L.S. Stephens, K.W. Kelly, S. Simhadri, A.B. McCandless, and E.I. Meletis, "Mechanical Property Evaluation and Failure Analysis of Cantilevered LIGA Nickel Microposts," Journal of Microelectromechanical Systems, 2001, 10 (3) pp. 347-359.
25. M. Strobel, U. Schmidt, K. Bade, and J. Halbritter, "Morphology and nucleation of Ni-TiO/sub 2/ LIGA layers," Presented in Electrochemical nanotechnology. In-situ local probe techniques at electrochemical interfaces, 1998, Weinheim, Germany, W.J.P. Lorenz, W., Editor, Wiley-VCH, pp. 215-224.
26. M. Strobel, U. Schmidt, K. Bade, and J. Halbritter, "Nucleation and growth of Ni-LIGA layers," Microsystem Technologies, 1996, 3 (1) pp. 10-16.
27. Z.L. Xie, D. Pan, H. Last, and K.J. Hemker, "Effect of as-processed and annealed microstructures on the mechanical properties of LIGA in MEMS," Materials Research Society Symposium - Proceedings, 2000, 605 pp. 197-202.
28. M. Zupan and K.J. Hemker, "Application of Fourier analysis to the laser based interferometric strain/displacement gage," Experimental Mechanics, 2002, 42 (2) pp. 214-220.
29. M. Madou, Fundamentals of Microfabrication. 2nd ed, 2002, New York, CRC Press.
30. "Reliability, Testing, and Characterization of MEMS/MOEMS III," Proceedings of the SPIE - The International Society for Optical Engineering, 2003, 5343 (1).
31. D. Sparks, M. Chia, and S. Zabinski, "Reliability of Resonant Micromachined Sensors and Actuators," 2001, Society of Automotive Engineers, Inc., Warrendale, PA, pp. 1-8.
32. D.R. Sparks, M.I. Chia, and G.Q. Jiang, "Cyclic fatigue and creep of electroformed micromachines," Sensors and Actuators, A: Physical, 2001, 95 (1) pp. 61-68.
33. S.M. Allameh, J. Lou, F. Kavishe, T.E. Buchheit, and W.O. Soboyejo, "An Investigation of Fatigue in LIGA Ni MEMS Thin Films," Materials Science & Engineering A (Structural Materials: Properties, Microstructure and Processing), 2004, 371 pp. 256-266.
34. B.L. Boyce, J.R. Michael, and P.G. Kotula, "Fatigue of Metallic Microdevices and the Role of Fatigue-Induced Surface Oxides," Acta Materialia, 2004, 52 pp. 1609-1619.
35. M. Srinivas, G. Malakondaiah, and P. Rama Rao, "Fracture toughness of FCC nickel and strain ageing BCC iron in the temperature range 77-773 K," Acta Metallurgica et Materialia, 1993, 41 (4) pp. 1301-1312.
36. M. Srinivas, G. Sundararajan, G. Malakondaiah, and P. Rama Rao, "An analysis of ductile fracture initiation toughness in iron, its binary alloys and nickel," Proceedings of the Royal Society of London, Series A (Mathematical and Physical Sciences), 1994, 447 (1930) pp. 237-251.
37. R.A. Mirshams, C.H. Xiao, S.H. Whang, and W.M. Yin, "R-curve characterization of the fracture toughness of nanocrystalline nickel thin sheets," Materials Science & Engineering A (Structural Materials: Properties, Microstructure and Processing), 2001, A315 (1-2) pp. 21-27.
38. B.V. Cockeram, "The fracture toughness and toughening mechanisms of nickel-base wear materials," Metallurgical and Materials Transactions A (Physical Metallurgy and Materials Science), 2002, 33A (1) pp. 33-56.
39. W.N. Sharpe, Jr., D.A. LaVan, and R.L. Edwards, "Mechanical properties of LIGA-deposited nickel for MEMS transducers," Presented in Proceedings of International Solid State Sensors and Actuators Conference (Transducers '97), 1997, New York, NY, USA, IEEE, pp. 607-610 vol.601.
40. S.D. Antolovich and A. Saxena, ASM Handbook. 5th ed. Failure Analysis and Prevention, Vol. 11, 1995, ASM International. 104-105.
List of Figures

Figure 1. Microstructure of LIGA Ni MEMS
Structures (a) micrograph of transverse columnar microstructure, (b) SEM image
of top (c) EBSD Image of the cross section of the sample
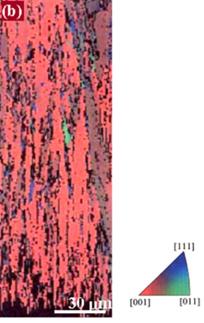
Figure 2. Orientation imaging micrograph of
the LIGA Ni sidewall
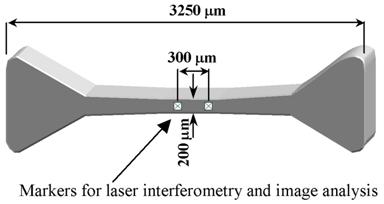
Figure 3. (a) Schematic of the dog-bone shape sample used for microtensile and microfatigue testing experiments.
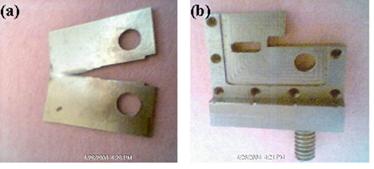
Figure 4. (a) The compact tension specimen
after J testing, (b) Jacket used to prevent buckling of the specimen around the
midsection
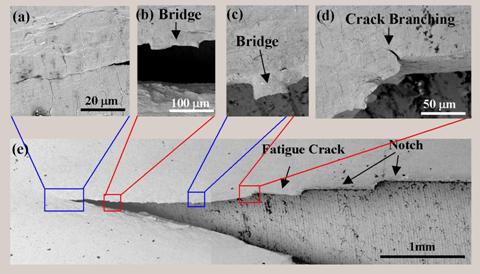
Figure 5. Crack-microstructure interaction: Prefabricated notch, fatigue precrack region and the tensile region seen along with magnified images of the tensile region showing crack branching, crack bridging, 45 degree lip of a wide bridge
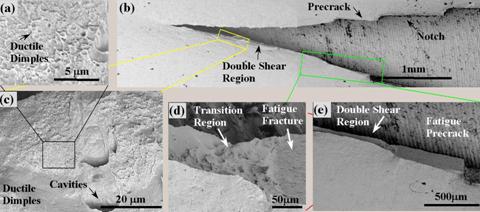
Figure 6. Fracture modes of the CT specimen: (a) overall view, (b) fatigue precrack (flat) and the monotonic tensile (narrow two-ridge region) , (c) juncture of fatigue and monotonic fracture, (d) late stages of fracture, (e) ductile dimple fracture
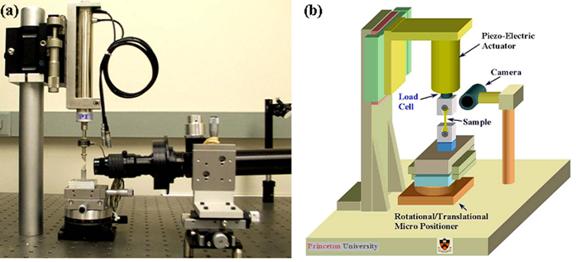
Figure 7. (a) Microfatigue testing system,
(b) the schematic of the microfatigue testing system
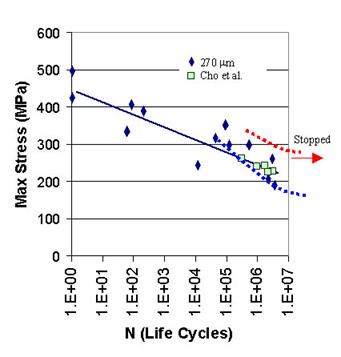
Figure 8. S-N Curve for 70 and 270 mm thick
LIGA Ni microsamples. Results of Cho et al. for their 250 mm thick sample is
shown as squares. Superimposed are the S-N curves for bulk nickel.

Figure 9. Crack nucleation at a stress
level of 250 MPa after 1.5 x 10⁶ cycles, (a) Fatigue crack initiated
on the top surface, (b) Fatigue crack nucleated at the corner of the sample,
(C) crack initiation site at the corner of the sample
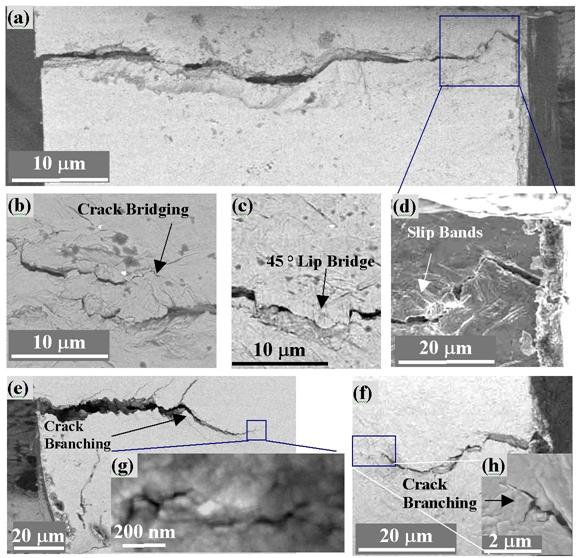
Figure 10. (a) Crack on the sidewall, (b) crack bridging, (c) inclined lip of a bridge, (d) propagation along slip planes, (e) top view (f) bottom view, (g) interaction of crack with the microstructure, (h) crack branching along slip bands

Figure 11. Cross-sectional TEM image of fatigue-induced oxidation of LIGA Ni
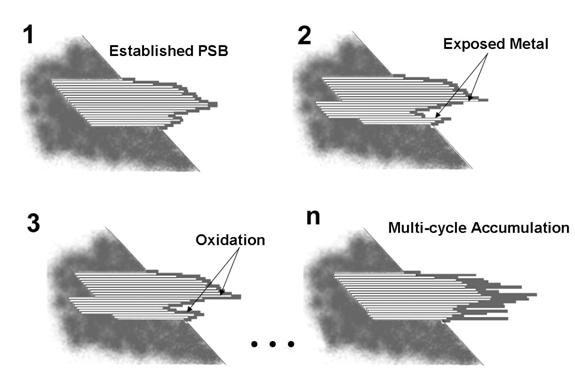
Figure 12. PSB-induced oxidation mechanism
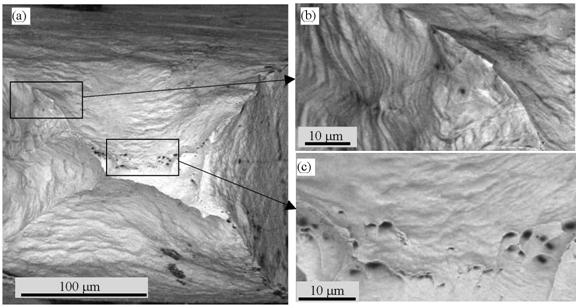
Figure 13. Fracture surface of Thick LIGA sample tested under fatigue at high stress levels (low life cycles): (a) Overall view, (b) Hi magnification of inclined surface, (c) cavitation holes
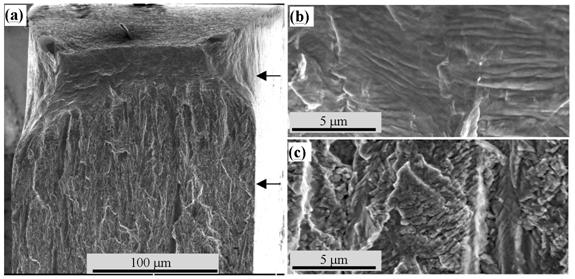
Figure 14. Fracture surface of Thick LIGA sample tested under fatigue at low stresses (high life cycles): (a) Overall view, (b) Hi magnification of fatigue mode fracture area, (c) Tensile mode fracture area
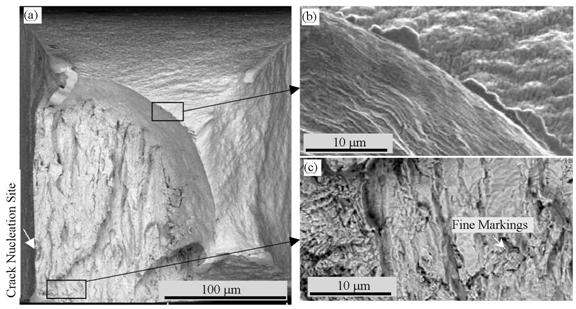
Figure 15. Fracture surface of thick LIGA sample tested under
fatigue at intermediate stress levels (intermediate life cycles): (a) Overall
view, (b) Tensile mode fracture area, (c) High magnification image of fatigue
mode fracture area
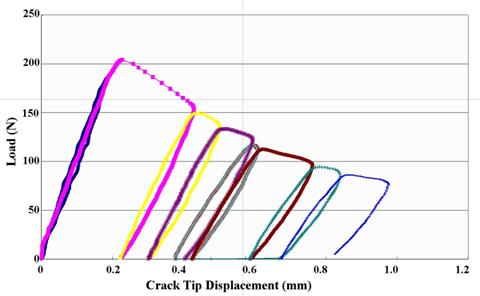
Figure 16. Calculation of J-integral from a series of load-displacement
curves obtained for the CT specimen